Molecular biology visualization tools for Shiny apps
Manual
The manual is available online
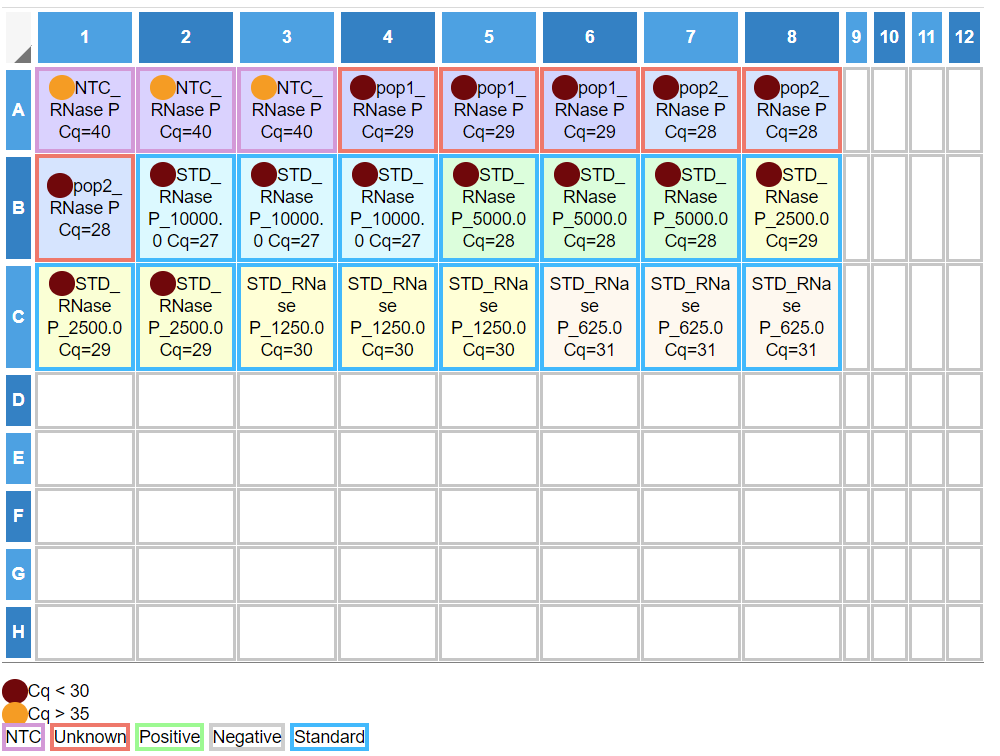
Create an input control for representing PCR plate and dynamically selecting wells inside it.
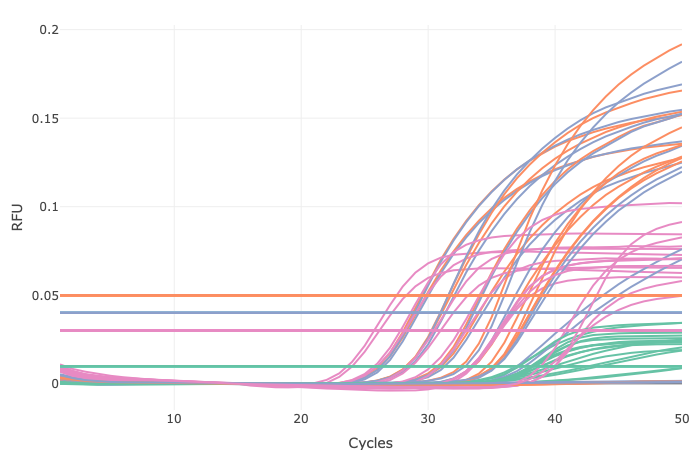
renderAmpCurves
Create a plot with the real-time PCR amplification curves.
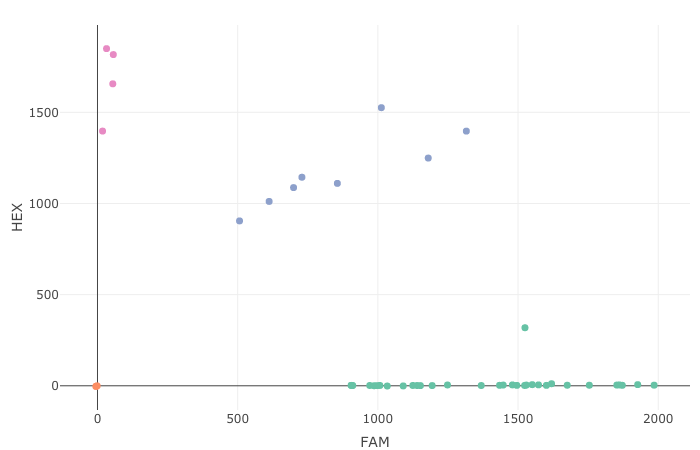
renderADplot
Create an allelic discrimination plot.