A function to calculate to head to tail ratio of amplification curve data from a quantitative PCR experiment
head2tailratio.Rdhead2tailratio is a function to calculate the ratio of the head and the
tail of a quantitative PCR amplification curve. In this test, only the head
(first six cycles) and the tail (last six cycles) form the region of interest
(ROI).
head2tailratio(y, normalize = FALSE, slope_normalizer = FALSE,
  verbose = FALSE)
Arguments
| y | is the cycle dependent fluorescence amplitude (y-axis). |
|---|---|
| normalize | is a logical parameter, which indicates if the amplification curve. |
| slope_normalizer | is a logical parameter, which indicates if the head2tailratio should be normalized to the slope of the ROI. |
| verbose | is a logical parameter, which indicates if all the values, parameters and coefficients of the analysis should be shown. |
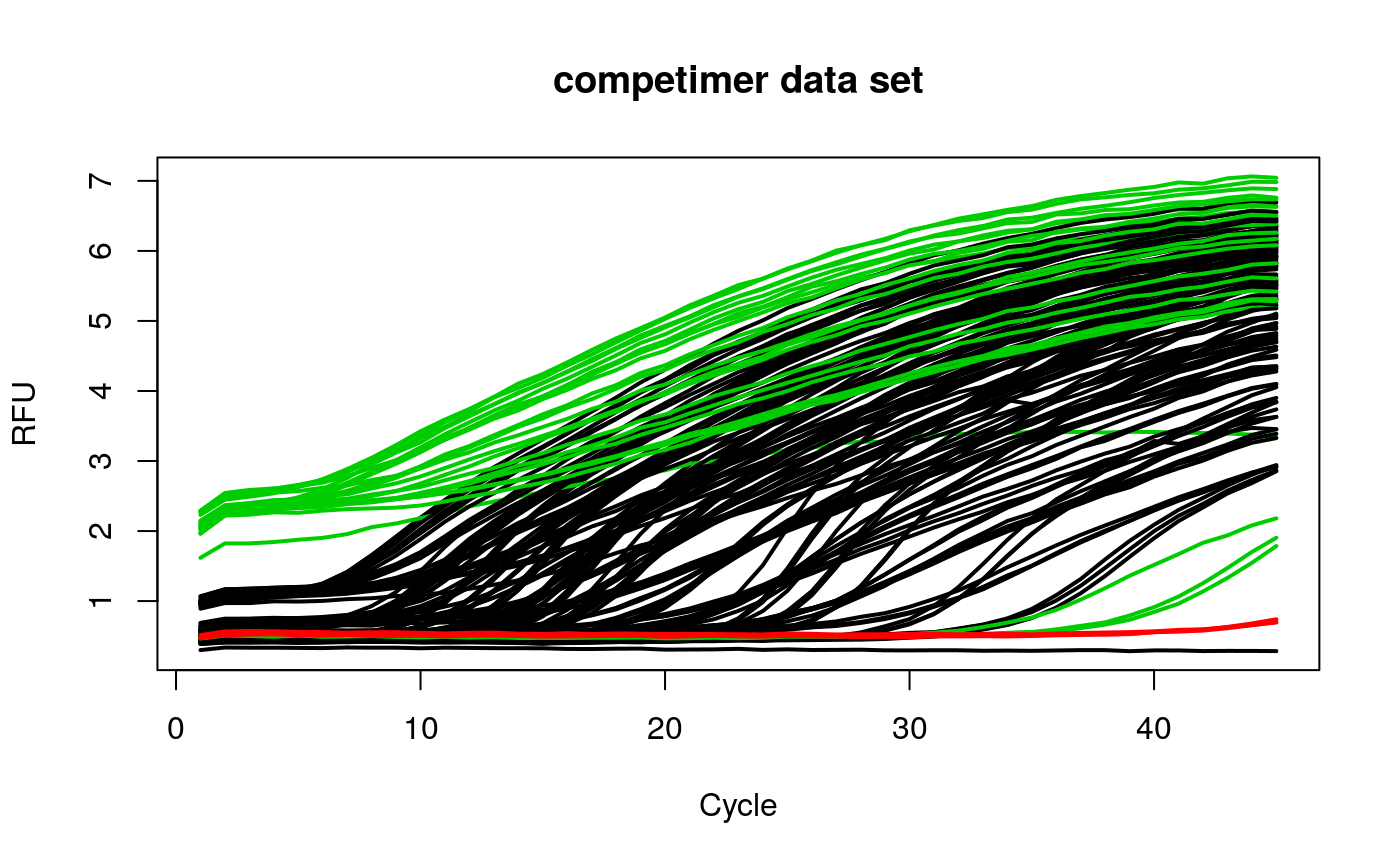
Examples
# calculate head to tail ratio on amplification curve data

library(qpcR)

res_head2tailratio <- sapply(2:ncol(competimer), function(i) {
   head2tailratio(y=competimer[, i], normalize=TRUE, slope_normalizer=TRUE)
})

res_head2tailratio_cluster <- kmeans(res_head2tailratio, 3)$cluster

matplot(competimer[, 1], competimer[, -1], xlab="Cycle", ylab="RFU",
        main="competimer data set", type="l", lty=1, col=res_head2tailratio_cluster, lwd=2)